Earlier on I have mostly used ESXTOP for basic troubleshooting reasons such as CPU ready and the like. Last weekend we had a major incident which was caused by a power outage which affected a whole server room. After the power was back on we had a number VMs that was showing very poor performance - as in it took about one hour to log in to Windows. It was quite random which VMs it was. The ESX hosts looked fine. After a bit of troubleshooting the only common denominator was that the slow VMs all resided on the same LUN. When I contacted the storage night duty the response was that there was no issue on the storage system.
I was quite sure that the issue was storage related but I needed some more data. The hosts were running v3.5 so troubleshooting towards storage is not easy.
I started ESXTOP to see if I could find some latency numbers. I found this excellent VMware KB article which pointed me in the right direction.
- For VM latency, start ESXTOP and press 'v' for VM storage related performance counters.
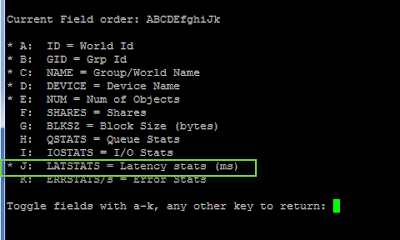
- The press 'f' to modify counters shown, then press 'h', 'i', and 'j' to toggle relevant counters (see screendump 2) - which in this case is latency stats (remember to stretch the window to see all counters)
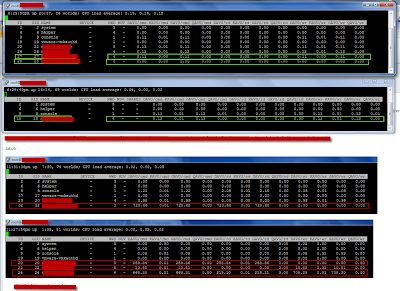
- What I found was that all affected VMs had massive latency towards the storage system for DAVG/cmd (see screendump 1) of about 700 ms (rule of thumb is that max latency should be about 20 ms). Another important counter is KAVG/cmd which is time commands spend in the VMkernel, the ESX host, (see screendump 3). So there was no latency in the ESX host and long latency towards the storage system.
After pressing the storage guys for a while, they had HP come take a look at it, and it turned out that there was a defect fiber port in the storage system. After this was replaced everything worked fine and latency went back to nearly zero.


No comments:
Post a Comment
Note: Only a member of this blog may post a comment.